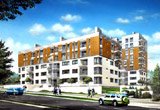
 SOME SAMPLES OF APARTMENTS AND FLATS PRICES IN WARSAW
Sample prices of apartments in Warsaw:
| pp # | bedr. | floor | sqm | balkon | Brutto |
| 1 | B | 0 | 36,06 | 0 | 165 140 |
| 2 | B | 0 | 38,52 | 7,95 | 193 249 |
| 3 |
| 0 | 92,69 | 8,42 | 442 322 |
| 4 |
| 1 | 110,67 | 7,59 | 534 746 |
| 6 |
| 1 | 92,6 | 8,44 | 451 860 |
| 7 |
| 2 | 110,67 | 7,59 | 546 588 |
| 10 |
| 3 | 110,56 | 3,8 | 549 861 |
| 12 |
| 3 | 92,73 | 11,38 | 478 542 |
| 13 |
| 4 | 110,68 | 3,56 | 561 783 |
| 15 |
| 4 | 92,49 | 11,38 | 487 263 |
| 17 | B | 0 | 38,52 | 7,95 | 193 249 |
| 18 |
| 0 | 76,23 | 8,95 | 368 064 |
| 19 |
| 1 | 76,23 | 8,93 | 376 179 |
| 21 |
| 1 | 110,67 | 7,59 | 534 746 |
| 24 |
| 2 | 110,67 | 7,59 | 546 588 |
| 27 |
| 3 | 110,56 | 3,8 | 549 861 |
|
|
|
|
|
|
|
| 32 |
| 0 | 103,97 | 7,61 | 547 888 |
| 34 |
| 1 | 122,63 | 16,46 | 662 076 |
| 36 |
| 2 | 122,54 | 16,46 | 674 727 |
| 38 |
| 3 | 126,7 | 8,13 | 692 358 |
| 39 |
| 4 | 88,87 | 16,97 | 538 033 |
| 42 |
| 5 | 126,61 | 7,85 | 745 474 |
| 47 |
| 8 | 88,68 | 16,97 | 698 268 |
| 48 |
| 8 | 126,38 | 8,14 | 961 127 |
| 49 |
| 0 | 58,32 | 7,28 | 313 707 |
| 50 |
| 0 | 60,66 | 7,28 | 325 675 |
| 51 |
| 0 | 50,14 | 7,79 | 272 950 |
| 52 |
| 1 | 93,22 | 19,15 | 517 354 |
| 55 |
| 2 | 93,22 | 19,15 | 527 329 |
| 58 |
| 3 | 88,65 | 15,17 | 504 520 |
| 61 |
| 4 | 88,65 | 16,97 | 536 790 |
| 70 |
| 7 | 88,47 | 11,46 | 590 363 |
| 73 |
| 8 | 88,47 | 13,26 | 688 840 |
| 74 |
| 8 | 65,26 | 8,23 | 504 837 |
| 75 |
| 8 | 49,98 | 11,73 | 398 132 |
In quarter I 2005, the average price per sqm in Warsaw grew by just over 0.5% and is currently 4,365 PLN. At the same time, in relation to the same time last year, this is a growth of 12.2%. The majority of districts in Warsaw are characterised by the same tendency.
The highest growth in price per sqm was recorded in Żoliborz (14.96%), Ursynów (7.91%) and Saska Kępa (6.96%). The increases in average price per sqm in Saska Kępa and Żoliborz due to the domination of those markets by expensive apartment buildings. Shrinking supply (especially of the cheapest flats) has caused price hikes in the ever popular Ursynów.
Record falls in prices have been recorded in the, until recently, most expensive district – Śródmieście. New projects have lead to a price correction of over 40% for the price per sqm and total price and over 20% fall in the average size. We observed a similar situation in Bielany, the change here, however, was a lot flatter (-9.3% in the average price per sqm, -15% in the average total price, and -4.8% in the average size).
Over a period of 12 months the highest growth in the average price per sqm took place in Wola (43.44%) and in Bielany (32.72%), whereas the highest falls where in Ochota (-20.21%) and in Wilanów (-15.80%).
The price movements in the two first districts were the result of shrinking of supply, whereas Bielany and Wilanów owe their falls to an increase in supply.
Warsaw – average prices:
1st quarter 2005: 4 365; 4th quarter 2005: 4 341; 1st quarter 2004: 3 892; change in price per sqm - 1st quarter 2005/4th quarter 2004: +0,56%; change in price per sqm - 1st quarter 2005/1st quarter 2004: +12,16%
The biggest group is made up of flats from 3,500 to 4,000 PLN (over 1/4 of those for). It was exactly this type of flats that is of most interest in quarter I. Cheaper flats, from 3,000 to 3,500 PLN/sqm enjoyed a lot of interest. However, their share of sales was only 11%.
When we observe demand and supply in the two most popular price segments (from 3,500 to 4,000 PLN and from 4,000 to 4,500 PLN), we can see that customers accepted a somewhat higher price. What’s more, there is excessive to demand in the most expensive price segment, the opposite of the situation in the cheapest segment. We can see excess demand for flats costing from 4,500 to 6,000 PLN/sqm. The market for apartments which exceed 6,000 PLN remains balanced.
